Visit coache.gse.harvard.edu for more partner resources.
© Copyright 2020, The President & Fellows of Harvard College
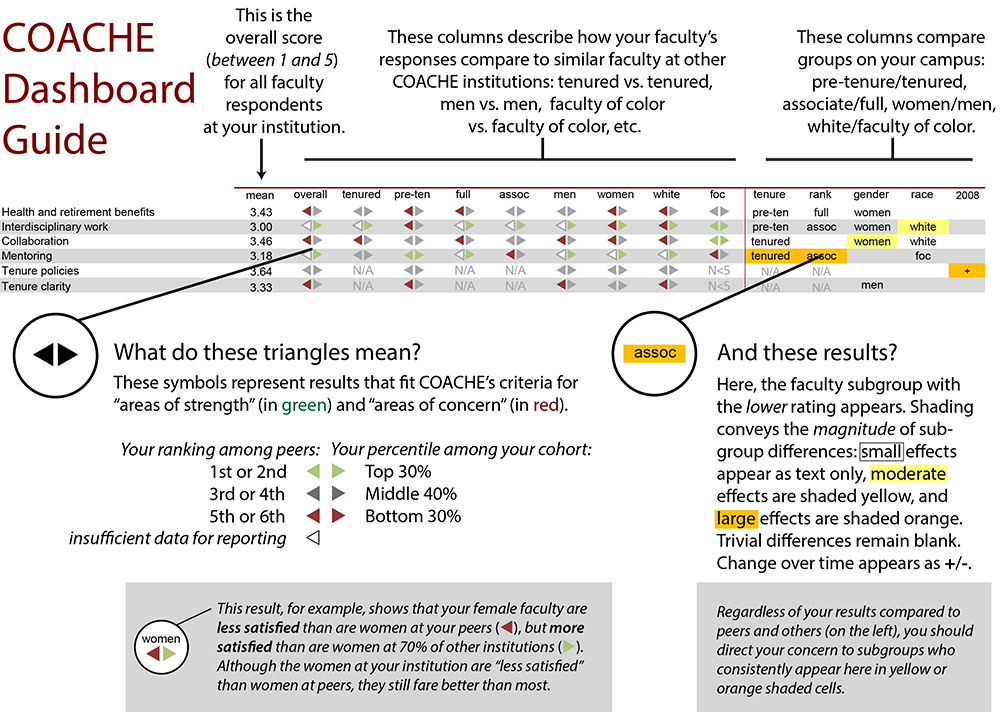
For help understanding this visualization, see
guide video or
guide note
on Benchmarks Dashboard.
To see the full name of subgroup, hover pointer over short name.
|
Your results compared to PEERS ◀
Your results compared to COHORT ▶ |
Areas of strength in GREEN
Areas of concern in RED |
Within campus differences
sm (.1)med. (.3)lrg. (.5) |
|||||||||||||||||||||||||
|
|
mean
|
overall
|
Hum
|
Soc
|
Phy
|
Bio
|
VPA
|
ECM
|
HHE
|
Agr
|
Bus
|
Edu
|
Med
|
Oth
|
Hum vs other
|
Soc vs other
|
Phy vs other
|
Bio vs other
|
VPA vs other
|
ECM vs other
|
HHE vs other
|
Agr vs other
|
Bus vs other
|
Edu vs other
|
Med vs other
|
Oth vs other
|
2017
|
|
Appreciation and Recognition
|
3.23
|


|

|

|

|
|
|
|
|
|
|
|
|
|
Hum
|
Soc
|
other
|
|
VPA
|
other
|
|
other
|
other
|
Edu
|
|
|
|
Recognition: For teaching |
3.30
|
|
|
|
|
|
|
|
|
|

|
|
|
|
|
|
|
other
|
VPA
|
|
HHE
|
other
|
other
|
|
|
|
|
Recognition: For advising |
3.02
|
|
|
|
|
|
|
|
|
|
|
|
|
|
Hum
|
Soc
|
|
|
VPA
|
other
|
|
|
other
|
Edu
|
|
Oth
|
-
|
Recognition: For scholarship |
3.32
|
|
|
|
|
|
|
|
|
|
|
|
|
|
Hum
|
Soc
|
other
|
Bio
|
VPA
|
|
|
other
|
other
|
|
|
|
|
Recognition: For service |
3.05
|
|
|
|
|
|
|
|
|
|
|
|
|
|
Hum
|
Soc
|
|
other
|
VPA
|
other
|
other
|
|
other
|
Edu
|
other
|
|
|
Recognition: For outreach |
3.13
|
|
|
|
|
|
|
|
|
|
|
|
|
|
|
Soc
|
|
Bio
|
VPA
|
other
|
|
|
other
|
Edu
|
|
Oth
|
|
Recognition: From colleagues |
3.62
|
|
|
|
|
|
|
|
|
|
|
|
|
|
Hum
|
Soc
|
|
Bio
|
|
other
|
|
other
|
other
|
Edu
|
|
|
|
Recognition: From CAO |
2.76
|
|
|
|
|
|
|
|
|
|
N<5
|
|
|
|
Hum
|
Soc
|
other
|
Bio
|
|
|
|
other
|
N<5
|
other
|
other
|
Oth
|
+
|
Recognition: From Dean |
2.95
|
|
|
|
|
|
|
|
|
|
N<5
|
|
|
|
|
Soc
|
other
|
other
|
VPA
|
|
other
|
other
|
N<5
|
other
|
other
|
Oth
|
|
Recognition: From Head/Chair |
3.47
|
|
|
|
|
|
|
|
|
|
|
|
|
|
Hum
|
|
other
|
other
|
VPA
|
|
|
|
|
Edu
|
|
other
|
-
|
School/college is valued by Pres/Provost |
3.29
|
|
|
|
|
|
|
|
|
|
|
|
|
|
Hum
|
Soc
|
other
|
other
|
VPA
|
other
|
|
other
|
Bus
|
Edu
|
other
|
Oth
|
+
|
Dept. is valued by Pres/Provost |
3.01
|
|
|
|
|
|
|
|
|
|
|
|
|
|
Hum
|
Soc
|
|
Bio
|
VPA
|
other
|
|
other
|
Bus
|
|
other
|
Oth
|
+
|
CAO cares about faculty of my rank |
3.18
|
|
|
|
|
|
|
|
|
|
|
|
|
|
Hum
|
Soc
|
other
|
Bio
|
|
|
other
|
other
|
other
|
|
Med
|
Oth
|
+
|